Fiji ImageJ, a powerhouse in the world of image analysis, is way more than just software; it’s a whole ecosystem. Think of it as your one-stop shop for everything from basic image adjustments to super-advanced techniques like 3D reconstruction and machine learning. Whether you’re a seasoned researcher or just starting out, Fiji’s got you covered. This guide dives deep into Fiji’s core functionality, exploring its powerful features and how to use them effectively.
We’ll cover everything from installing Fiji and mastering basic image processing to leveraging its vast plugin library for specialized tasks. We’ll also explore the power of scripting for automation and tackle common troubleshooting issues. By the end, you’ll be comfortable navigating Fiji’s features and applying them to your own image analysis projects, regardless of whether you’re working with microscopic images, medical scans, or something else entirely.
Fiji ImageJ’s Core Functionality
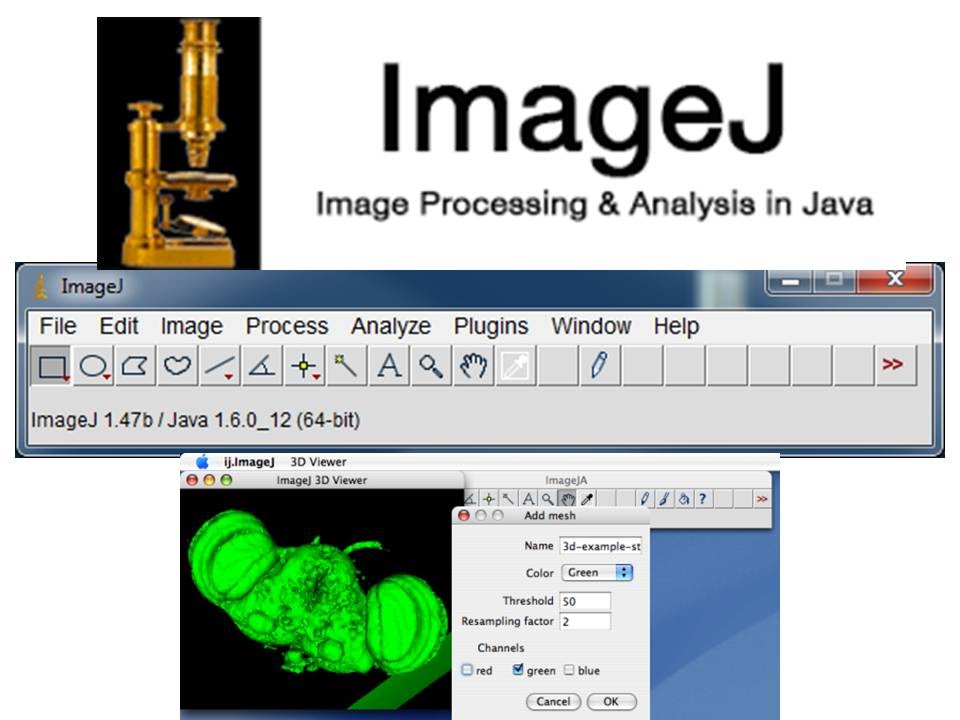
Fiji is an open-source, user-friendly image analysis package built on top of ImageJ, a powerful but sometimes daunting program for scientists and researchers. Both offer a wide range of tools for image processing, analysis, and visualization, but Fiji simplifies the process considerably, making it accessible to a broader range of users. Understanding their core functionalities and key differences is crucial for choosing the right tool for your image analysis needs.Fiji and ImageJ share a common foundation but differ significantly in their ease of use and built-in functionalities.
ImageJ provides the basic framework for image manipulation, offering core tools for image processing, measurement, and analysis. Think of it as the engine – powerful, but requiring some mechanical knowledge to operate effectively. Fiji, on the other hand, takes that engine and adds a user-friendly interface, pre-installed plugins, and streamlined workflows, making it much easier to navigate and use for a wide variety of image analysis tasks.
It’s like adding a sleek body and automatic transmission to that powerful engine.
Fiji Installation
Installing Fiji is straightforward. First, navigate to the Fiji website (imagej.net/Fiji/downloads.html). Then, download the appropriate installer for your operating system (Windows, macOS, or Linux). Once downloaded, run the installer, following the on-screen prompts. It’s generally a simple process of accepting the license agreement and choosing an installation directory.
After installation is complete, launch Fiji. You should see the main Fiji window, ready for you to start analyzing images. Remember to check for updates periodically to ensure you have access to the latest features and bug fixes.
Feature Comparison of Fiji and Other Image Analysis Software, Fiji imagej
Choosing the right image analysis software depends on your specific needs and expertise. Here’s a comparison of Fiji with some other popular options. Note that this table presents a simplified overview, and the capabilities of each software can vary significantly depending on installed plugins and extensions.
| Feature | Fiji | ImageJ | CellProfiler | Imaris |
|---|---|---|---|---|
| Ease of Use | High | Medium | Medium | Low |
| Cost | Free | Free | Free (academic) | Commercial |
| Plugin Support | Extensive | Extensive | Limited | Limited |
| 3D/4D Image Analysis | Yes | Yes (with plugins) | Yes | Excellent |
Image Processing Techniques in Fiji
Fiji, built upon the robust ImageJ platform, offers a vast array of image processing techniques crucial for biological image analysis. These techniques range from basic adjustments like brightness/contrast alterations to sophisticated algorithms for segmentation and 3D visualization. Mastering these tools is key to extracting meaningful information from microscopic images.
Common Image Processing Techniques
Fiji provides a comprehensive suite of tools for manipulating image data. These include adjustments to brightness and contrast, which are fundamental for optimizing image visibility and highlighting subtle features. Beyond basic adjustments, Fiji facilitates more advanced operations like filtering, which helps to remove noise or enhance edges, and transformations, including rotations and scaling, to adjust image orientation and resolution.
These capabilities are readily accessible through Fiji’s user-friendly interface, making complex image manipulations straightforward.
Filter Use for Image Enhancement
Filters in Fiji act as digital signal processors, modifying pixel values based on predefined algorithms. For instance, Gaussian blur filters are frequently used to reduce noise by averaging pixel intensities within a defined radius. Conversely, sharpening filters, such as the Unsharp Mask, enhance edges and details by increasing the contrast between adjacent pixels. The choice of filter depends heavily on the specific image and the desired outcome; experimenting with different filter types and parameters is often necessary to achieve optimal results.
For example, a low-pass filter might be used to smooth out background noise in a microscopy image of cells, while a high-pass filter could highlight cell boundaries.
Segmentation Methods in Fiji
Segmentation, the process of partitioning an image into meaningful regions, is essential for quantitative image analysis. Fiji supports various segmentation methods. Thresholding, a simple yet powerful technique, assigns pixels above a certain intensity value to one region and those below to another. More sophisticated methods include watershed segmentation, which identifies individual objects based on intensity gradients, and edge detection, which Artikels regions based on sharp intensity changes.
For instance, watershed segmentation could be used to separate individual cells in a densely packed tissue sample, while edge detection could be used to delineate the boundaries of a specific organ in a medical image. The selection of the appropriate segmentation method depends on the image characteristics and the nature of the objects being analyzed.
Microscopic Image Analysis Workflow
A typical workflow for analyzing microscopic images using Fiji might involve several steps. First, the image is imported and inspected for any artifacts or inconsistencies. Then, brightness and contrast are adjusted to optimize visualization. Next, noise reduction techniques, such as Gaussian blurring, might be applied. Subsequently, an appropriate segmentation method (e.g., thresholding or watershed) is chosen to identify regions of interest.
Finally, measurements are made on these regions, such as area, perimeter, or intensity, providing quantitative data for further analysis. For example, in analyzing fluorescence microscopy images of cells, one might use thresholding to identify cells, then measure their fluorescence intensity to assess protein expression levels. The specifics of this workflow will vary depending on the experimental design and the type of data being analyzed.
Fiji’s Plugin Ecosystem
Fiji’s power isn’t just in its core functionality; it’s massively boosted by its extensive plugin ecosystem. Think of it like this: Fiji is a powerful base game, but the plugins are the expansion packs, adding tons of specialized tools and features to tackle almost any image analysis challenge. This vast library of community-contributed plugins allows Fiji to adapt to a wide range of research needs, far exceeding the capabilities of a single, monolithic application.The availability of plugins significantly expands Fiji’s versatility.
Users can tailor their image processing workflow to their specific needs, adding functionality for tasks not directly supported by the core software. This modularity allows for a highly customized and efficient analytical process.
Popular Fiji Plugins and Their Functionality
Several plugins stand out due to their widespread use and powerful features. For instance, the “TrakEM2” plugin provides advanced capabilities for 3D image analysis, allowing for the reconstruction and visualization of complex structures from stacks of images. Another widely used plugin is “CellProfiler,” known for its robust cell-based image analysis features. It excels at automating tasks such as cell segmentation, identification, and measurement.
Finally, “ImageJ Macro Recorder” is essential for automating repetitive tasks, creating custom macros to streamline workflows. These three plugins highlight the diverse functionality available within the Fiji ecosystem.
Advantages and Disadvantages of Using Plugins
Using plugins offers numerous advantages, including increased functionality, specialized tools for niche applications, and community support for troubleshooting and feature requests. However, there are also potential drawbacks. Plugin compatibility can be an issue, with some plugins potentially conflicting with others or requiring specific Fiji versions. Furthermore, the quality and reliability of plugins can vary, requiring careful selection and evaluation before implementation.
Additionally, the learning curve for some plugins can be steep, demanding significant time investment for effective utilization.
Fiji Plugins for Specific Image Analysis Tasks
Choosing the right plugin is crucial for efficient image analysis. Here’s a list categorizing plugins based on common tasks:
Plugins for various image analysis tasks are available within Fiji’s extensive plugin ecosystem. The choice of plugin depends heavily on the specific requirements of the analysis.
- Cell Counting: CellProfiler, Analyze Particles
- 3D Reconstruction: TrakEM2, 3D Viewer
- Image Segmentation: Trainable Weka Segmentation, MorphoLibJ
- Particle Analysis: Analyze Particles, 3D ImageJ Suite
- Colocalization Analysis: JACoP, Coloc 2
Analyzing Specific Image Types with Fiji
Fiji’s versatility shines in its ability to handle diverse image types, each requiring specific processing techniques for optimal analysis. Understanding these nuances is crucial for extracting meaningful results from your microscopy data. This section will explore the tailored approaches for processing fluorescence, brightfield, and confocal microscopy images.
Fluorescence Image Processing
Fluorescence microscopy relies on the detection of emitted light from fluorescently labeled samples. Image processing in Fiji often involves adjusting brightness/contrast, background subtraction, and noise reduction to enhance the signal-to-noise ratio and reveal subtle details. A common workflow might begin with adjusting the brightness and contrast using the “Brightness/Contrast” tool to optimize the visualization of the fluorescent signal.
So, I’m working on this Fiji ImageJ project, analyzing some seriously cool microscopy data. I need to make a quick tutorial video to show my lab mates, and to do that, I’ll need to grab some clips from YouTube. That’s why I’m hitting up download youtube video converter to snag those clips. Then, it’s back to Fiji ImageJ for more image processing and analysis!
This is followed by background subtraction using tools like “Rolling Ball Background Subtraction” to remove uneven illumination artifacts. Noise reduction can be achieved using filters such as Gaussian blur, which smooths the image while preserving important features. Finally, thresholding techniques, such as Otsu’s thresholding, can be used to segment regions of interest. For example, analyzing images of cells stained with a fluorescent antibody requires careful background correction to avoid overestimating the signal.
Brightfield Image Processing
Brightfield microscopy relies on transmitted light, resulting in images with varying contrast and illumination. Processing often centers on enhancing contrast and sharpening features. Typical steps include adjusting brightness and contrast, followed by applying sharpening filters like the Unsharp Mask filter to improve the visibility of fine details. Other adjustments might involve color correction to compensate for variations in staining or illumination.
For instance, analyzing a brightfield image of histological tissue might involve using the “Enhance Contrast” tool followed by a “Sharpen” filter to improve the visibility of cell boundaries and tissue structures.
Confocal Microscopy Image Processing
Confocal microscopy generates high-resolution images with optical sectioning capabilities. Image processing often focuses on removing noise, correcting for optical aberrations, and generating 3D reconstructions. Initial steps might involve noise reduction using filters such as median filtering or wavelet denoising to reduce speckle noise. Z-stack processing is a key aspect, often involving maximum intensity projections or 3D rendering to visualize the three-dimensional structure of the sample.
For example, analyzing a confocal z-stack of a developing embryo requires careful alignment and processing of the individual images to create a high-quality 3D reconstruction.
Medical Image Processing in Fiji
Fiji is increasingly used for medical image analysis due to its open-source nature and extensive plugin ecosystem. Processing medical images often requires careful consideration of ethical implications and data privacy. Image preprocessing may include techniques like histogram equalization for contrast enhancement, followed by image segmentation using thresholding or more advanced methods like watershed segmentation. For example, analyzing a medical image of a cancerous tissue sample might involve using a combination of thresholding and region-growing algorithms to segment the tumor from the surrounding healthy tissue.
The choice of techniques depends heavily on the specific type of medical image and the analytical goals. Quantitative analysis might then be performed on the segmented regions to extract features relevant for diagnosis or prognosis. Remember that appropriate ethical considerations and compliance with relevant regulations are paramount when working with medical images.
Fiji for Quantitative Image Analysis
Fiji’s power extends far beyond basic image manipulation; it’s a robust platform for quantitative image analysis, allowing researchers to extract meaningful numerical data from their images and perform statistical analyses. This capability is crucial for validating hypotheses, drawing conclusions, and publishing findings in various scientific fields.
Quantitative Measurements in Fiji
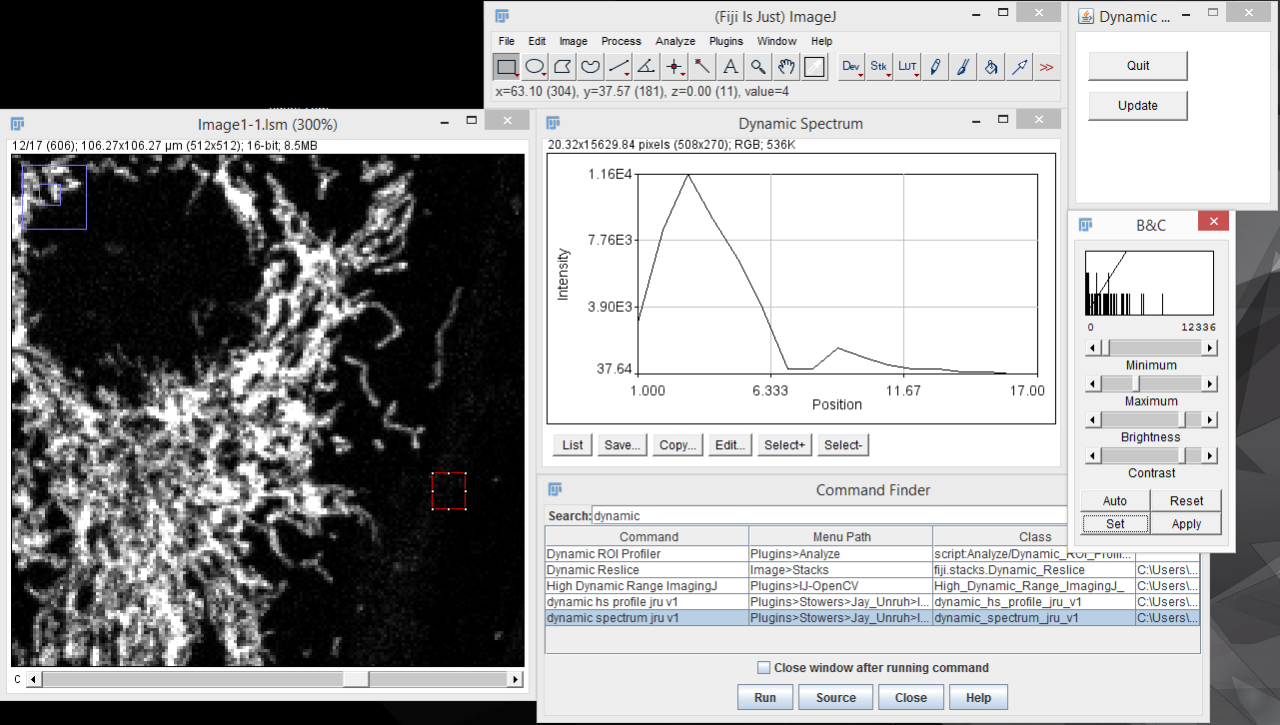
Fiji offers a variety of tools for making quantitative measurements directly on images. The “Measure” function, accessible through the “Analyze” menu, provides basic measurements like area, perimeter, and mean gray value for selected regions of interest (ROIs). More advanced measurements, such as Feret’s diameter (the longest distance between any two points on the object’s boundary), can also be obtained using the “Analyze Particles” function.
This function is particularly useful for analyzing cell populations or identifying objects within an image based on size and intensity thresholds. For example, you could use this to count the number of cells in a microscopic image and measure their average size. Furthermore, the “Plot Profile” function allows you to analyze the intensity of pixels along a line drawn across the image, providing valuable information about gradients or changes in intensity across a region.
Generating Graphs and Charts from Image Data
Once quantitative data has been extracted, Fiji provides several ways to visualize it. The “Results” window displays the measurements made, and this data can be directly copied and pasted into spreadsheet software like Excel or Google Sheets for further analysis and graph creation. Alternatively, Fiji’s built-in plotting capabilities, accessible through the “Plot” function, can create basic graphs like histograms and line graphs directly within the software.
For example, a histogram can show the distribution of cell sizes, while a line graph could display the intensity profile along a specific line. These plots can be exported as image files (e.g., PNG, JPG) for inclusion in reports or publications.
Exporting Data from Fiji for Further Analysis
Fiji offers several methods for exporting data for external analysis. The simplest approach is copying data from the “Results” window, as mentioned previously. However, for more complex analyses, it’s often beneficial to export data in a more structured format, such as a CSV (Comma Separated Values) file. This can be done using the “Save As” option in the “Results” window, choosing “Comma Separated Values” as the file type.
This allows seamless integration with statistical software packages like R, SPSS, or Python, enabling more sophisticated statistical modeling and analysis.
Statistical Analyses Performed on Image Data Using Fiji
While Fiji itself doesn’t perform advanced statistical tests, the data it provides forms the foundation for such analyses in external statistical software. For instance, after measuring the area of multiple cells, you could use external software to perform a t-test to compare the average cell size between two experimental groups. Similarly, data on intensity values could be used to perform ANOVA (Analysis of Variance) to determine if there are significant differences in intensity among multiple groups.
Correlation analysis could be used to investigate relationships between different measurements (e.g., cell area and intensity). The exported data from Fiji is simply the input for these more complex statistical analyses performed elsewhere. For example, a researcher studying the effect of a drug on cell growth might use Fiji to measure cell area in treated and untreated samples, then use R to perform a t-test to determine if there is a statistically significant difference in cell size between the two groups.
Scripting and Automation in Fiji
Fiji’s powerful image processing capabilities are significantly enhanced by its scripting capabilities, allowing users to automate repetitive tasks and customize workflows. This opens up possibilities for high-throughput analysis and reproducible research. By writing scripts, users can streamline their image analysis pipelines, reducing manual effort and minimizing human error.
Fiji primarily supports two scripting languages: Macros (a simple scripting language embedded within ImageJ) and Jython (a Java implementation of Python). Macros are great for quick tasks and simple automation, while Jython offers more power and flexibility for complex image processing pipelines, leveraging the vast Python ecosystem’s libraries.
Macro Scripting in Fiji
Macros provide a straightforward way to automate sequences of ImageJ commands. They are written in a simple, interpreted language that directly translates to ImageJ actions. This makes them ideal for beginners and for quickly automating short sequences of operations. A macro is essentially a sequence of commands that you would normally perform manually in the ImageJ GUI.
Once written, the macro can be saved and executed repeatedly, saving considerable time and effort.
Jython Scripting in Fiji
Jython, a Java-based implementation of Python, provides a more robust and versatile scripting environment. It allows users to access the full power of ImageJ’s Java API, along with the extensive libraries available in Python. This allows for much more complex and sophisticated automation than is possible with macros alone. For instance, one can incorporate numerical computation libraries like NumPy or data manipulation libraries like Pandas to handle large datasets generated from image analysis.
Examples of Automating Image Processing Tasks
Let’s consider automating a common task: measuring the area of multiple cells in a microscopy image. A macro could be written to open the image, threshold it to segment the cells, analyze particles to identify individual cells, and then output the measured areas to a spreadsheet. Similarly, a Jython script could perform the same operations but with greater control over parameters, potentially incorporating more advanced image segmentation techniques or statistical analysis.
Benefits of Automation in Fiji
Automation in Fiji offers several key advantages:
- Increased Efficiency: Automating repetitive tasks drastically reduces processing time and human effort.
- Improved Reproducibility: Scripts ensure that image processing steps are consistently applied across multiple images or datasets.
- Reduced Error: Automation minimizes the risk of human error during data processing.
- Enhanced Throughput: Batch processing of large image datasets becomes feasible, enabling high-throughput analysis.
- Customization: Scripts allow users to tailor image processing workflows to their specific needs.
A Simple Macro Example
This macro opens an image, applies a Gaussian blur, and then converts it to 8-bit grayscale:
run(“Open…”);
run(“Gaussian Blur…”, “sigma=2”);
run(“8-bit”);
This simple example demonstrates the basic syntax of a Fiji macro. More complex macros can be built by combining multiple ImageJ commands and control structures.
Advanced Image Analysis Techniques
Fiji ImageJ, beyond its core functionalities, offers a powerful suite of advanced tools for tackling complex image analysis challenges. This section delves into sophisticated techniques, including image registration, colocalization analysis, machine learning applications, 3D image analysis, and a structured workflow for analyzing multi-channel images. These techniques are crucial for extracting meaningful biological insights from increasingly complex microscopy datasets.
Image Registration
Image registration is the process of aligning two or more images acquired from the same sample at different time points, with different modalities (e.g., fluorescence and brightfield), or from different angles. In Fiji, plugins like the “BigWarp” plugin provide powerful tools for this. The process typically involves identifying corresponding features (landmarks) in the images and using these to transform one image to match the others.
For example, in time-lapse microscopy, registering images corrects for small movements of the sample, allowing for accurate tracking of cell migration or other dynamic processes. Accurate registration is critical for generating reliable quantitative measurements across multiple images. Different registration algorithms are employed depending on the type of images and the degree of expected transformation, ranging from simple translations and rotations to more complex warping techniques.
Colocalization Analysis
Colocalization analysis aims to determine the extent to which two or more fluorescent signals overlap within a cell or tissue. This is essential for understanding the spatial relationships between different proteins or cellular structures. Fiji offers several plugins for colocalization analysis, such as the “Coloc 2” plugin, which calculates various colocalization coefficients (e.g., Pearson’s correlation coefficient, Manders’ coefficients) to quantify the degree of overlap.
For instance, researchers might use colocalization analysis to determine whether two proteins are interacting within a specific cellular compartment. The interpretation of colocalization results requires careful consideration of potential artifacts, such as bleed-through between fluorescence channels, and the use of appropriate controls.
Machine Learning in Fiji
Fiji’s plugin ecosystem incorporates machine learning capabilities for automated image analysis tasks. Plugins such as “Trainable Weka Segmentation” allow users to train classifiers on labeled images to segment objects of interest (e.g., cells, nuclei) automatically. This significantly reduces manual effort and increases throughput for large datasets. For example, a researcher could train a classifier to identify specific types of cells within a tissue section, enabling high-throughput analysis of cell populations.
This automation improves the accuracy and consistency of image analysis, especially when dealing with large or heterogeneous datasets.
3D Image Analysis in Fiji
Fiji provides robust tools for analyzing 3D image stacks, commonly acquired using confocal or light-sheet microscopy. The “3D Viewer” allows for interactive visualization and manipulation of 3D data. Tools for surface rendering, volume rendering, and 3D measurements are readily available. For example, a researcher could analyze the 3D structure of a developing organ or quantify the volume of specific organelles within cells.
Advanced 3D analysis often involves techniques like image segmentation, object tracking, and morphometric measurements to extract quantitative data about the three-dimensional organization of structures within the sample.
Workflow for Analyzing Complex Multi-Channel Images
Analyzing multi-channel images often involves a series of steps. First, images are typically corrected for background noise and other artifacts. Then, individual channels are processed separately using techniques such as thresholding, segmentation, and filtering to isolate objects of interest. Next, colocalization analysis might be performed to determine the spatial relationships between different channels. Finally, quantitative measurements (e.g., area, intensity, colocalization coefficients) are extracted and statistically analyzed.
For example, a researcher might analyze multi-channel images of cells stained for different proteins to determine the subcellular localization of each protein and their interactions. Careful planning and documentation of the analysis workflow are crucial for reproducibility and accurate interpretation of results. The use of scripting languages like ImageJ Macro or Jython can automate repetitive tasks and enhance reproducibility.
Troubleshooting Common Fiji Issues
Let’s face it, even the best software can throw you a curveball sometimes. Fiji, while incredibly powerful, isn’t immune to the occasional hiccup. This section will cover some common problems you might encounter and offer solutions to get you back on track with your image analysis. Knowing how to troubleshoot effectively can save you hours of frustration.
Common Fiji Errors and Their Solutions
This table provides a quick reference guide for resolving frequently encountered Fiji errors. Understanding the cause of the error is crucial for finding the right solution. Remember to always check your input data and Fiji’s settings before assuming a major problem.
| Error | Cause | Solution |
|---|---|---|
| Out of Memory Error | Fiji is attempting to process an image larger than the available RAM. This is especially common with large multi-channel or high-resolution images. | Reduce image size using the “Image > Scale” function before processing. Consider using smaller regions of interest (ROIs) for analysis. You might also need to increase your computer’s RAM or use a more efficient algorithm. Fiji’s “Memory & Threads” settings can also be adjusted to optimize memory usage. |
| Plugin Errors (e.g., “Plugin failed to load”) | The plugin might be corrupted, incompatible with your Fiji version, or missing required dependencies. | Reinstall the plugin. Ensure you’re using a compatible Fiji version and all necessary libraries. Check the plugin’s documentation for specific requirements or troubleshooting steps. |
| File Format Errors (e.g., “Cannot open file”) | The file might be corrupted, in an unsupported format, or the file path is incorrect. | Verify the file integrity. Ensure Fiji supports the file format. Double-check the file path for typos. Try converting the image to a supported format like TIFF or JPEG. |
| Unexpected Results from Image Processing | Incorrect parameters in a processing function, or inappropriate use of a plugin for the specific image type. | Carefully review the parameters used in each processing step. Ensure the plugin you’re using is appropriate for your image type and the analysis you’re performing. Consult the plugin’s documentation or online resources for guidance. Experiment with different parameter values. |
| Slow Processing Speed | Large image sizes, complex algorithms, or insufficient computer resources. | Optimize image size (as mentioned above). Consider using faster algorithms or reducing the complexity of your analysis. Ensure your computer meets the minimum system requirements for Fiji. |
Best Practices for Avoiding Fiji Issues
Proactive measures can significantly reduce the frequency of encountering problems.Regularly updating Fiji to the latest version is crucial for bug fixes and improved performance. Before starting a complex analysis, always test your workflow on a small subset of your data to identify and resolve any potential issues early on. Thoroughly understanding the parameters of each function and plugin you use is also key.
Finally, always back up your original image data to prevent accidental loss. Saving your Fiji macros and scripts can also help avoid repetitive work and prevent errors.
Visualizing and Presenting Results

So, you’ve crunched the numbers in Fiji, and now you have a mountain of data. The next step? Making sense of it all and presenting your findings in a clear, compelling way. Effective visualization is key to communicating your research effectively, whether you’re writing a lab report, preparing a presentation, or submitting a paper for publication. This section will walk you through various techniques to showcase your Fiji-powered image analysis results.
Image analysis often generates complex datasets. Simply presenting raw numbers isn’t going to cut it. You need to translate those numbers into visual representations that highlight key trends, patterns, and differences. This involves choosing appropriate visualization methods depending on the type of data and the message you want to convey. Remember, a well-designed figure can speak volumes, while a poorly designed one can obscure your findings entirely.
Image Overlay and Colocalization
Image overlays are a powerful way to compare different channels or images. For instance, if you’re studying protein localization, you might overlay a fluorescent image of a specific protein onto a brightfield image of the cell. Fiji makes this easy using tools like the “Merge Channels” command. Color-coding different channels allows for immediate visual identification of colocalization (where two or more signals overlap).
A good example would be visualizing the overlap between a marker for a specific cellular organelle (e.g., mitochondria stained with MitoTracker Red) and a marker for a protein of interest (e.g., GFP-tagged protein). The degree of overlap directly indicates the protein’s localization within that organelle. Visualizing this colocalization with a merged image allows for a quick assessment of the relationship between the two.
Graphs and Charts for Quantitative Data
Fiji itself doesn’t have built-in advanced graphing capabilities, but it integrates seamlessly with other software like GraphPad Prism or Excel. After extracting your quantitative data (e.g., mean intensity values, cell counts, measurements), you can export it to these programs to generate various graphs and charts. Bar charts are excellent for comparing means across different groups. Scatter plots are useful for visualizing correlations between two variables.
Line graphs are ideal for showing changes over time or across a continuous variable. For example, if you’re measuring the fluorescence intensity of a protein over time, a line graph would clearly demonstrate any changes in intensity.
Creating Publication-Quality Figures
Fiji allows for considerable control over image appearance. Adjusting brightness/contrast, applying color maps, and adding scale bars are crucial for producing professional-looking figures. The “Image > Adjust > Brightness/Contrast” command allows for fine-tuning. Fiji also provides various color palettes to highlight specific features. Remember to always include a scale bar for proper context and to maintain consistent figure formatting throughout your publication.
Export your images as high-resolution TIFF or EPS files for optimal quality in print. Avoid using JPEGs for scientific publications, as they are lossy compression formats.
Template for Presenting Image Analysis Results in a Scientific Report
A typical figure in a scientific report should include: (1) A concise and informative figure caption explaining the experiment, methods, and key findings; (2) Clearly labeled axes with units (if applicable); (3) A legend explaining different colors or symbols used; (4) A scale bar indicating the size of features; (5) High-resolution images with appropriate brightness and contrast; (6) Statistical analysis (e.g., p-values, error bars) where appropriate.
For example, a figure showing cell counting might include a representative image with cells highlighted, a bar graph showing the average cell count per condition with error bars, and a statistical test indicating the significance of differences between groups. Maintain a consistent style and format across all figures within the report.
Case Studies: Fiji in Research: Fiji Imagej
Fiji ImageJ, with its extensive capabilities and user-friendly interface, has become a cornerstone in various research fields, enabling researchers to analyze and interpret complex image data efficiently. Its open-source nature and vast plugin ecosystem further enhance its adaptability and utility across diverse scientific disciplines. This section will explore several case studies illustrating Fiji’s impactful applications in scientific research.
Fiji in Biomedical Research: Cell Counting and Analysis
Fiji’s image processing and analysis tools are frequently employed in biomedical research for tasks such as cell counting, cell morphology analysis, and colocalization studies. Researchers leverage Fiji’s built-in functions and plugins to segment cells from background noise, measure their size and shape, and quantify the expression of specific proteins within cells. For instance, a study analyzing the effects of a novel drug on cancer cell proliferation might use Fiji to automatically count and measure the size of treated and untreated cancer cells, providing quantitative data to assess the drug’s efficacy.
In comparison to dedicated cell counting software, Fiji offers a flexible and cost-effective alternative, particularly for researchers with limited budgets. Often, the analysis workflow can be automated through scripting, making high-throughput analysis feasible.
Fiji in Neuroscience: Neuron Tracing and Quantification
Fiji plays a crucial role in neuroscience research, facilitating the analysis of microscopic images of brain tissue. Researchers use Fiji’s tools for neuron tracing, quantifying the length and branching complexity of neuronal processes, and measuring the density of neurons in specific brain regions. Plugins like NeuronJ are specifically designed to assist in these tasks, automating the process of tracing complex neuronal structures and providing quantitative measurements.
While other software packages exist for neuronal image analysis, Fiji often offers a more accessible and versatile platform, especially for researchers unfamiliar with specialized software. The ability to combine various plugins and customize workflows within Fiji adds significant value for neuroscience research.
Fiji in Plant Biology: Chlorophyll Quantification and Leaf Area Measurement
Fiji is extensively used in plant biology for analyzing images of plant tissues and organs. For example, researchers use Fiji to quantify chlorophyll content in leaves by analyzing the color intensity of images. They can also measure leaf area, shape, and other morphological features, providing valuable data for plant growth studies and ecological research. The use of Fiji’s color thresholding and measurement tools simplifies these tasks, enabling efficient analysis of large datasets.
Compared to dedicated plant phenotyping software, Fiji offers a more general-purpose approach, which can be beneficial when researchers need to perform multiple types of analysis on the same image data.
Summary of Research Articles Utilizing Fiji
In a study published inNature Communications*, researchers used Fiji to analyze microscopic images of immune cells, quantifying their migration patterns in response to an inflammatory stimulus. The authors highlighted Fiji’s ability to automate the image analysis process, enabling the analysis of a large number of images in a short time.
A research article inPLOS ONE* detailed the use of Fiji for analyzing images of plant roots, measuring root length and branching complexity. The authors compared Fiji’s performance to other image analysis software and found that Fiji provided comparable results while being more user-friendly and accessible.
A study published inScientific Reports* employed Fiji for analyzing microscopic images of cancer cells, quantifying the expression of a specific protein marker. The authors demonstrated the effectiveness of Fiji’s plugin ecosystem, utilizing a custom plugin to automate the analysis workflow and increase efficiency.
Future Trends and Developments in Fiji
Fiji’s future hinges on its ability to adapt to the ever-evolving landscape of biological imaging and image analysis. The platform’s open-source nature and vibrant community are key strengths that will continue to drive innovation and expansion. We can expect significant advancements in several key areas.Fiji’s development will likely focus on enhancing user experience, expanding its analytical capabilities, and integrating seamlessly with cutting-edge imaging technologies.
This will involve improvements to the user interface, the addition of new algorithms and plugins, and the development of robust interfaces with other software packages commonly used in bioimaging research.
Enhanced User Interface and Workflow
A more intuitive and streamlined user interface is a high priority. This includes improved navigation, more efficient tool organization, and the potential integration of machine learning-based tools to guide users through complex analysis tasks. Think of it like going from a basic calculator to a sophisticated graphing calculator – easier to use, more powerful, and capable of more complex operations.
For example, Fiji could incorporate AI-powered suggestions for image processing steps based on the image type and the user’s goals, significantly reducing the learning curve for new users.
Integration with Advanced Imaging Modalities
The rapid development of new microscopy techniques, such as light-sheet microscopy, super-resolution microscopy, and advanced electron microscopy, demands that Fiji adapt. Future versions will likely include dedicated plugins and tools optimized for processing and analyzing data from these techniques. For instance, we might see streamlined workflows for processing terabyte-sized datasets from light-sheet microscopy, including automated stitching and registration algorithms.
This will be crucial for handling the ever-increasing data volumes generated by modern imaging systems.
Expansion of Analytical Capabilities
Fiji’s strength lies in its extensibility. Future development will concentrate on adding more sophisticated analytical tools, especially in the areas of quantitative image analysis, 3D image processing, and single-cell analysis. This could involve the integration of advanced machine learning algorithms for automated cell counting, segmentation, and feature extraction. Imagine a plugin that automatically identifies and quantifies different cell types within a complex tissue sample, saving researchers countless hours of manual work.
This would move Fiji beyond simple image processing and firmly establish it as a comprehensive quantitative analysis platform.
Improved Scripting and Automation
Fiji’s scripting capabilities using macro languages (like ImageJ’s built-in scripting language and potentially others) will be further enhanced to allow for more complex and efficient automation of image analysis workflows. This could involve the development of more user-friendly scripting interfaces and the incorporation of advanced programming concepts to streamline repetitive tasks. This would be particularly beneficial for high-throughput screening experiments and large-scale image analysis projects, allowing researchers to automate complex processes and analyze thousands of images in a fraction of the time.
Cloud-Based Capabilities
A potential future direction is the integration of cloud-based functionalities. This would allow researchers to share and process large image datasets more easily, potentially leveraging the computational power of cloud computing resources for faster and more efficient analysis. This could also facilitate collaborative research projects by allowing multiple researchers to access and work on the same datasets simultaneously. This mirrors the trend of cloud-based data analysis in other scientific fields, offering significant advantages in terms of scalability and accessibility.
End of Discussion
Fiji ImageJ isn’t just software; it’s a versatile tool that empowers researchers across various fields. From basic image enhancements to complex quantitative analyses and sophisticated 3D visualizations, Fiji’s adaptability and extensive plugin ecosystem make it a truly indispensable resource. Whether you’re analyzing microscopic images, medical scans, or satellite data, mastering Fiji opens up a world of possibilities for extracting meaningful insights from your images.
So grab your images, fire up Fiji, and get ready to unlock the secrets hidden within your data!
FAQ Insights
Is Fiji ImageJ free?
Yep, it’s open-source and completely free to use!
What operating systems does Fiji support?
Fiji runs on Windows, macOS, and Linux.
Can I use Fiji for video analysis?
Absolutely! Fiji has robust capabilities for processing and analyzing video data.
How do I get help if I’m stuck?
Check out the ImageJ/Fiji forums and documentation – tons of helpful resources are available.
What’s the difference between Fiji and ImageJ?
ImageJ is the core program; Fiji is a pre-packaged distribution of ImageJ with many useful plugins already included.